Summarized from the DNA analysis of the Newfoundland produced using the ICB Breeder tool. Breeders can access data files and perform test matings with a subscription to the ICB Breeder tool for this breed.
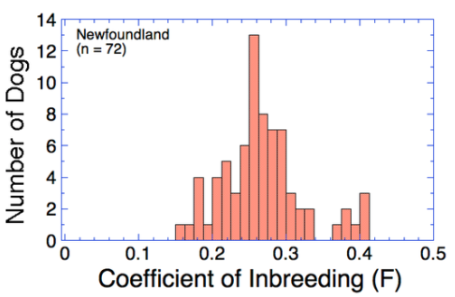
Genomic inbreeding (F) in the Newfoundland is high.
For perspective, the average inbreeding for a litter produced by a cross of first cousins is 6.25%, a half-sib cross is 12.5%, and 25% from a full-sib cross (assumes the parents are unrelated).
Inbreeding in all dogs in this sample is higher than about 15% (0.15), and in most animals inbreeding is above 20%, and several dogs were 40% or more.
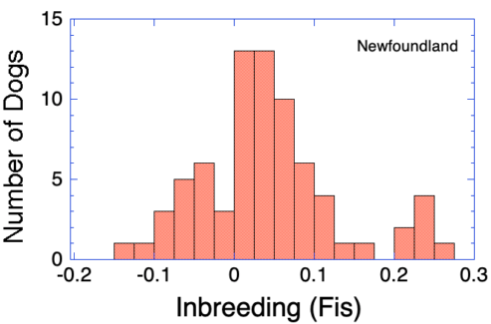
We can also assess inbreeding using the fixation index (Fis). This is inbreeding relative to the amount of genetic diversity in the population. If the population is randomly breeding, Fis would be 0. Values of Fis > 0 reflect preferential inbreeding (more inbreeding than expected by chance), and Fis < 0 indicates avoidance of inbreeding.
These data show that breeders are often preferentially inbreeding by selecting parents that are more related to each other than average.
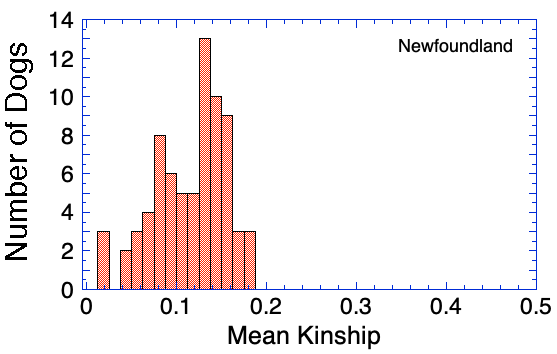
The kinship coefficient (K) indicates the degree of genetic similarity between two individuals due to common ancestry.
Mean kinship of an individual is the average of all of the pairwise kinship coefficients with every animal in the population. Animals with the lowest mean kinship are less similar genetically to the other animals in the population than those with high mean kinship. Dogs with lower mean kinship are therefore genetically more valuable to the population in terms of maintaining genetic diversity.
An animal with a mean kinship coefficient of 0.25 is on average as closely related to the rest of the population as a full sibling. An animal with a mean kinship of 0.0625 is on average as related to the rest of the population as a first cousin. (You will notice that these numbers are the same as above for inbreeding.)
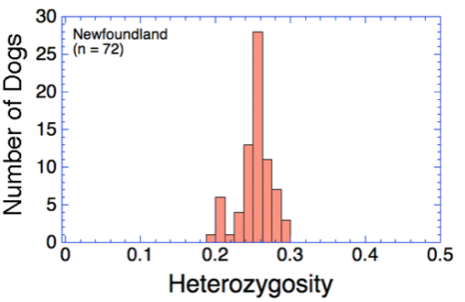
Heterozygosity (Ho) is the fraction of loci that have two different alleles (versus homozygosity, in which the alleles are the same). Thus, heterozygosity is a measure of genetic diversity.
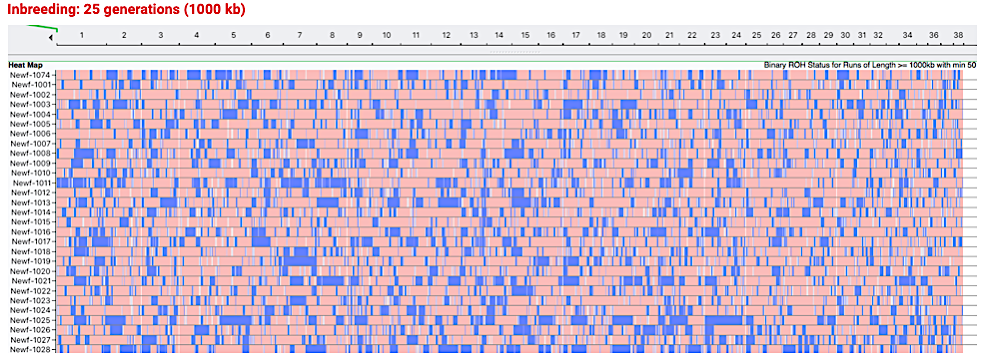
This chart allows you to visualize the areas of inbreeding on the chromosomes. The chromosomes are strung end to end and numbered across the top from 1 to 38.
Each row is the chromosomes for an individual dog. (The chart contains only a subsample of the approximately 160 dogs in this analysis.Only every other dog is identified because of space.)
Homozygous areas, called “runs of homozygosity” (ROH) are indicated in blue. In an outbred dog, the regions of homozygosity would be infrequent and very short.
Blocks of homozygosity tend to get inherited together (this is called “linkage disequilibrium”), making it more difficult for breeders to select for and against specific genes. Deleterious alleles tend to get trapped in these blocks, making them more difficult to manage.
Click edio.
Breeders can access data for individual dogs, produce custom reports, and explore test matings with a subscription to the ICB Breeder Tool for the Boxer for only $75/year.