Genetic Diversity
Traits & Disorders
Genetic Ranks
Genetic Structure
Kinship
ROH
Traits*
Health*
mtDNA & Y Haplotypes*
PCA*
Genetic Diversity
Error
You are trying to load a table of an unknown type. Probably you did not activate the addon which is required to use this table type.
You are trying to load a table of an unknown type. Probably you did not activate the addon which is required to use this table type.
Traits & Disorders
Error
You are trying to load a table of an unknown type. Probably you did not activate the addon which is required to use this table type.
You are trying to load a table of an unknown type. Probably you did not activate the addon which is required to use this table type.
Genetic Ranks
Sorted by rank


Genetic Structure
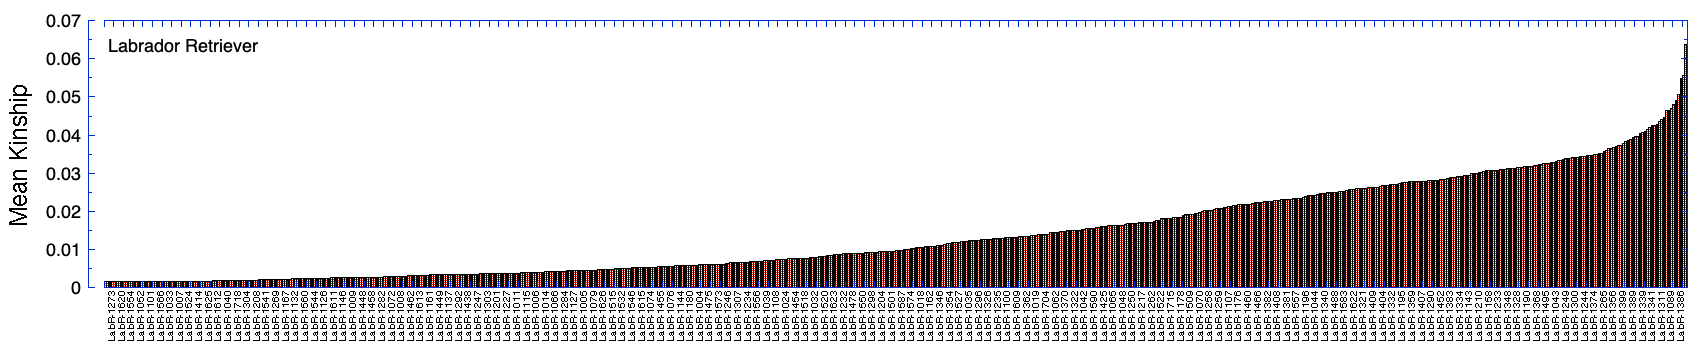
The dendrogram and heat map for genetic structure are produced from the kinship coefficients. The dog IDs have been left off for the sake of space. The dogs can be identified on a version provided to breeders when needed.
Males only

Females only

Kinship
DogsArk Kinship Analysis Tool v3.0
Kinship Coefficient Thresholds
Matrix Display Mode
Kinship Coefficient (K) Matrix
Animal Selection
▼Males
Females
Distribution Analysis
Histogram Type
Statistical Summary
ROH
Runs of Homozygosity
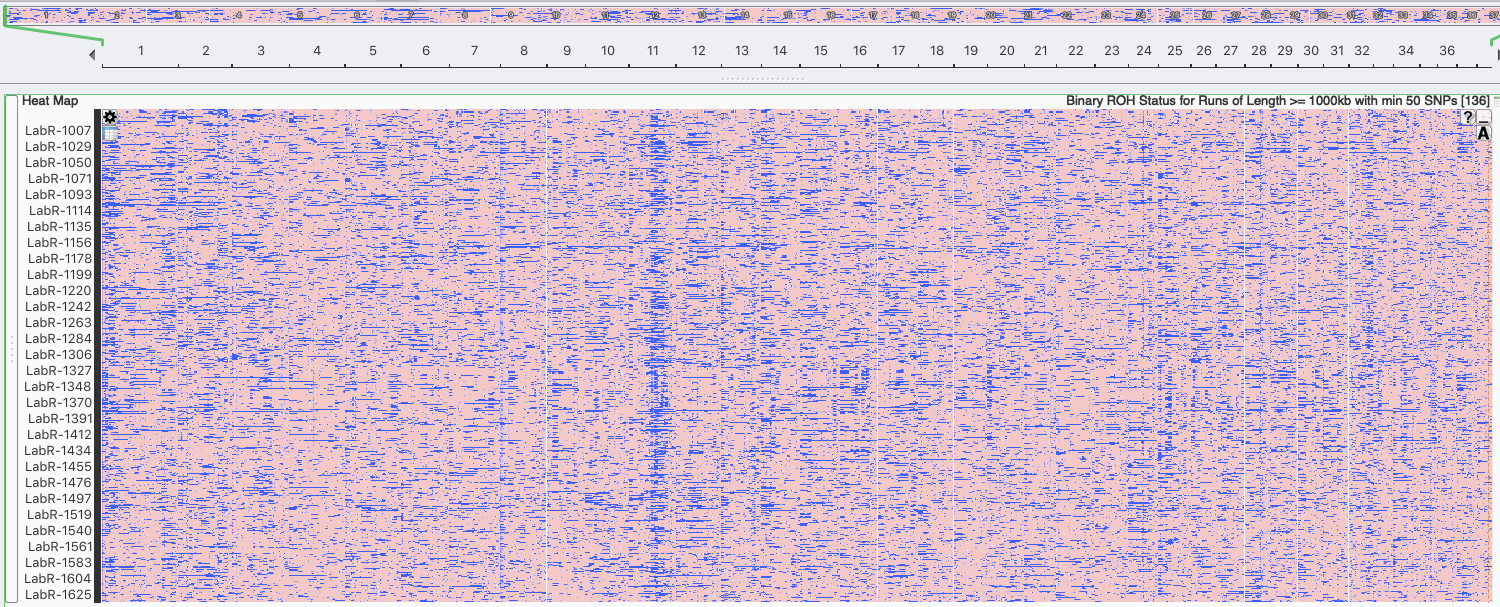
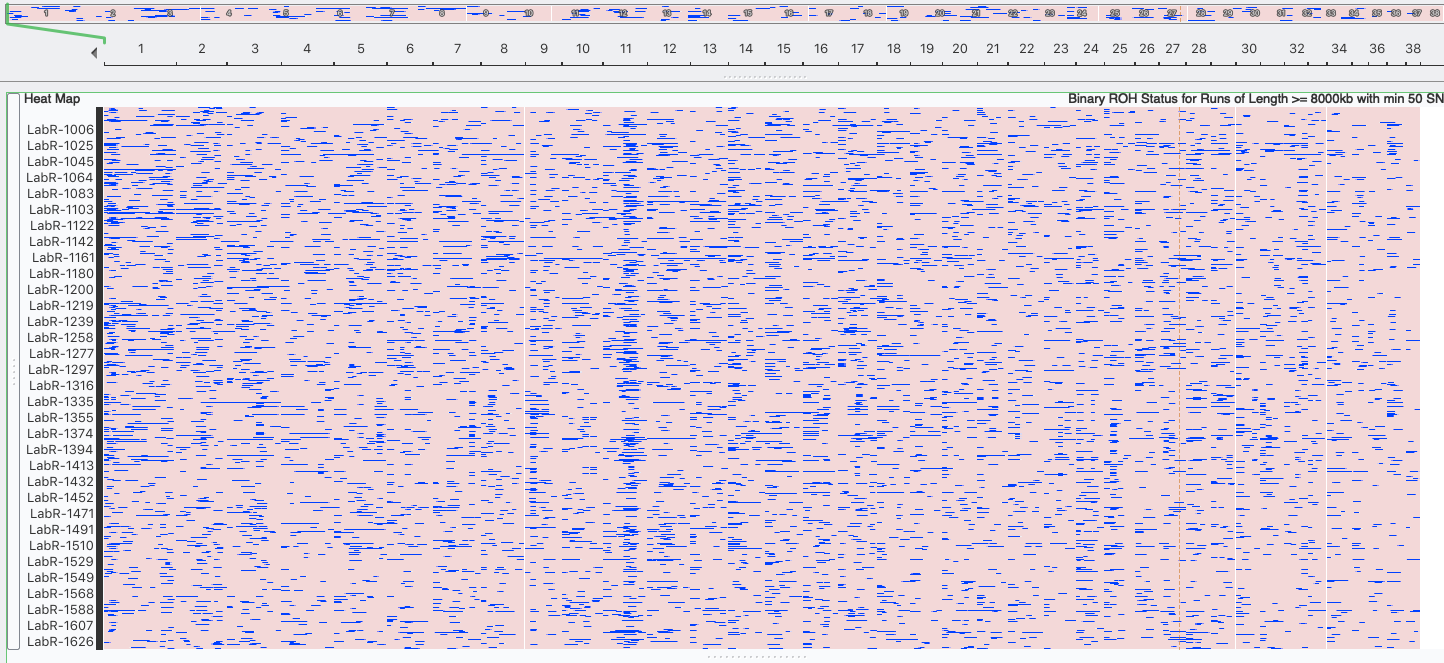
Inbreeding tends to produce runs (blocks) of homozygosity (ROH) on the chromosomes. Over time, the crossing-over of chromosomes during meiosis can split up blocks of homozygosity, so the largest blocks are likely to be the most recent inbreeding and smaller blocks reflect older inbreeding. ROH are used to estimate inbreeding from SNP data.
Learn more about Runs of Homozygosity.
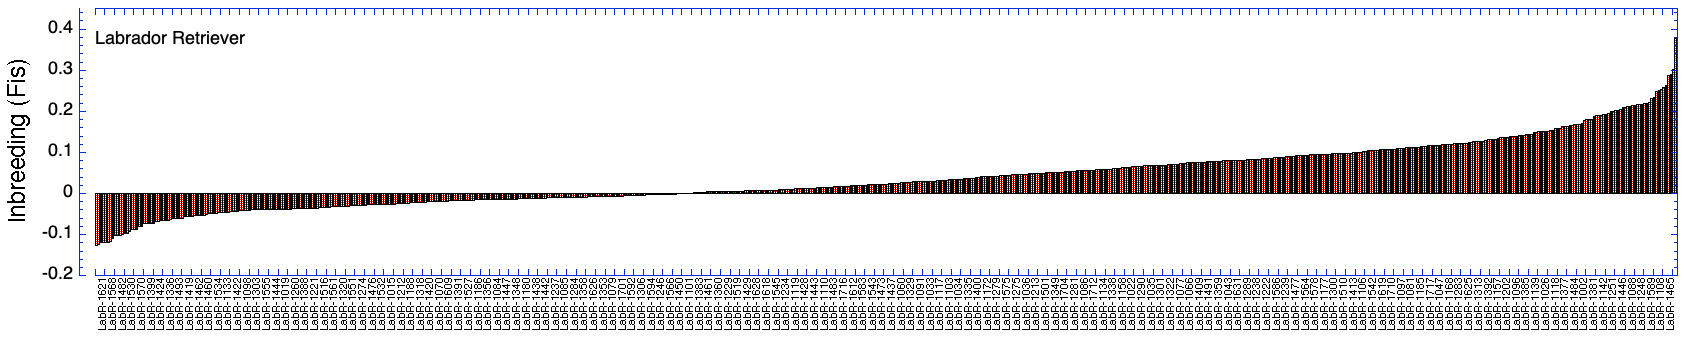
Inbreeding: 25 generations (1000 kb)
Inbreeding: 6 generations (8000 kb)
Traits*
Health*
Labrador Mast Cell Tumor
The data in this analysis include dogs that were part of a research study at Cornell University on mast cell tumors in Labrador Retrievers.
- Data from:
Hayward et al., 2015. Complex disease and phenotype mapping in the domestic dog. Nature Communicatiions DOI: 10.1038/ncomms10460.
This study searched for genes that might be responsible for mast cell tumors in Labrador Retrievers. They found an association close to a potential candidate gene but did not identify a causative gene.
“…GWAS of MCT in Labrador Retrievers (152 cases, 106 controls) revealed a significant QTL on CFA36 (P1/41.7107, b1/40.36, Wald test; Fig. 2d), within 30 kb of the candidate gene ITGA6.”
So unfortunately, a single gene that breeders could target for selection was not found. In the absence of an identified gene, the same data are used here to create a dendrogram – a map of genetic relatedness – based on kinship coefficients. Then, coding to identify control and affected dogs is added to the dendrogram: one asterisk for control dogs and three asterisks for affected dogs. Dogs without designation have no information.
There are several useful things to see. First, MCT appears to be widespread in the breed, at least as represented by this (anonymous) population. Importantly, there are several clusters of related dogs that in which MCT was not reported. Most of the rest of the dogs are not closely related, so it is not possible to know if the odd single dog without MCT represents a line of closely related dogs that do not get this form of cancer.
It would be useful to add to these data more individuals both with and without MCT, especially including family groups that might reveal lineages with low risk of the disease.
* – control
***- affected

mtDNA & Y Haplotypes*
NA
PCA*
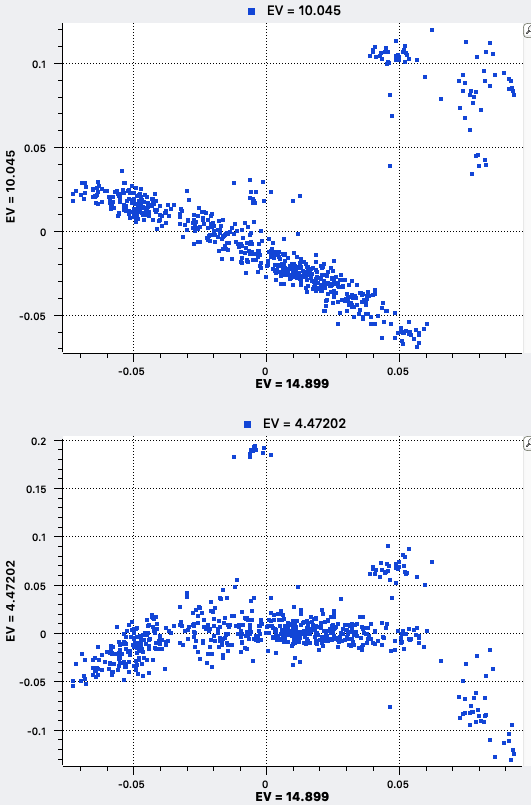
Principal Components Analysis