Genetic Diversity
Traits & Disorders
Genetic Ranks
Genetic Structure
Kinship
ROH
Traits*
Health*
mtDNA & Y Haplotypes*
PCA*
Genetic Diversity
Genetic Diversity
Great Dane Inbreeding
| wdt_ID | ICB Code | Inbreeding (F) | Inbreeding (Fis) | Mean Kinship (mK) | Heterozygosity (Ho) |
|---|---|---|---|---|---|
| 1 | GrtD-1001 | 0.323 | 0.193 | 0.157 | 0.226 |
| 2 | GrtD-1002 | 0.206 | 0.131 | 0.059 | 0.244 |
| 3 | GrtD-1003 | 0.191 | -0.005 | 0.114 | 0.281 |
| 4 | GrtD-1004 | 0.199 | -0.013 | 0.125 | 0.284 |
| 5 | GrtD-1005 | 0.181 | -0.032 | 0.139 | 0.289 |
| 6 | GrtD-1006 | 0.325 | -0.040 | 0.116 | 0.291 |
| 7 | GrtD-1007 | 0.196 | 0.135 | 0.050 | 0.242 |
| 8 | GrtD-1008 | 0.394 | -0.019 | 0.139 | 0.286 |
| 9 | GrtD-1009 | 0.322 | 0.229 | 0.133 | 0.216 |
| 10 | GrtD-1010 | 0.389 | 0.127 | 0.061 | 0.245 |
| 11 | GrtD-1011 | 0.268 | 0.230 | 0.062 | 0.216 |
| 12 | GrtD-1012 | 0.204 | 0.072 | 0.129 | 0.260 |
| 13 | GrtD-1013 | 0.450 | -0.016 | 0.098 | 0.285 |
| 14 | GrtD-1014 | 0.354 | 0.295 | 0.127 | 0.198 |
| 15 | GrtD-1015 | 0.202 | 0.163 | 0.171 | 0.234 |
| 16 | GrtD-1016 | 0.263 | -0.011 | 0.116 | 0.283 |
| 17 | GrtD-1017 | 0.232 | 0.050 | 0.123 | 0.266 |
| 18 | GrtD-1018 | 0.395 | 0.018 | 0.170 | 0.275 |
| 19 | GrtD-1019 | 0.480 | 0.230 | 0.160 | 0.216 |
| 20 | GrtD-2001 | 0.349 | 0.327 | 0.144 | 0.189 |
Traits & Disorders
Traits & Disorders
Genetic Ranks
Sorted by rank
Genetic Structure
Genetic Structure
The dendrogram and heat map for genetic structure are produced from the kinship coefficients.
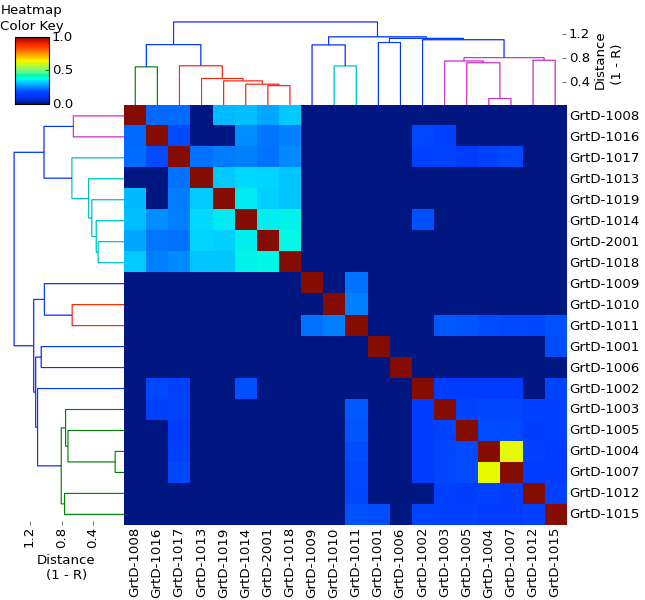
Kinship
Kinship Coefficient
The kinship coefficient (K) is the fraction of the genome shared by two individuals that is homozygous by descent, so it is a pairwise measure of relatedness.
This kinship matrix is color coded to identify cells in which K < 0.0625 (6.25%; green, equivalent to a cross of first cousins), K = 0.125 (12.5%; yellow, half-sib cross), and K > 0.25 (25%; red, full sib cross). The kinship coefficient between a male and female is also the predicted average inbreeding coefficient of their offspring if they produced a litter.
ROH
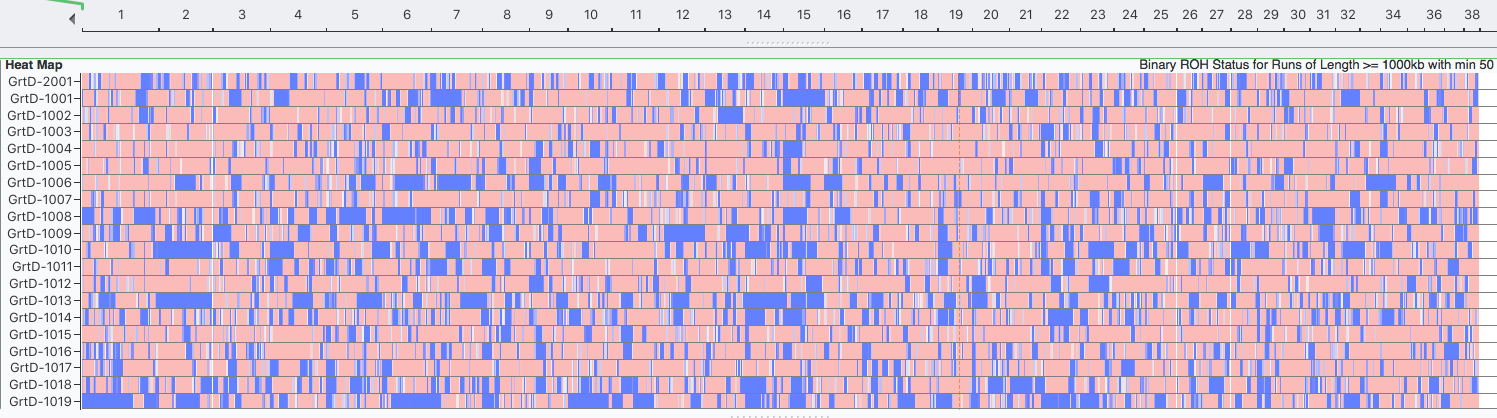
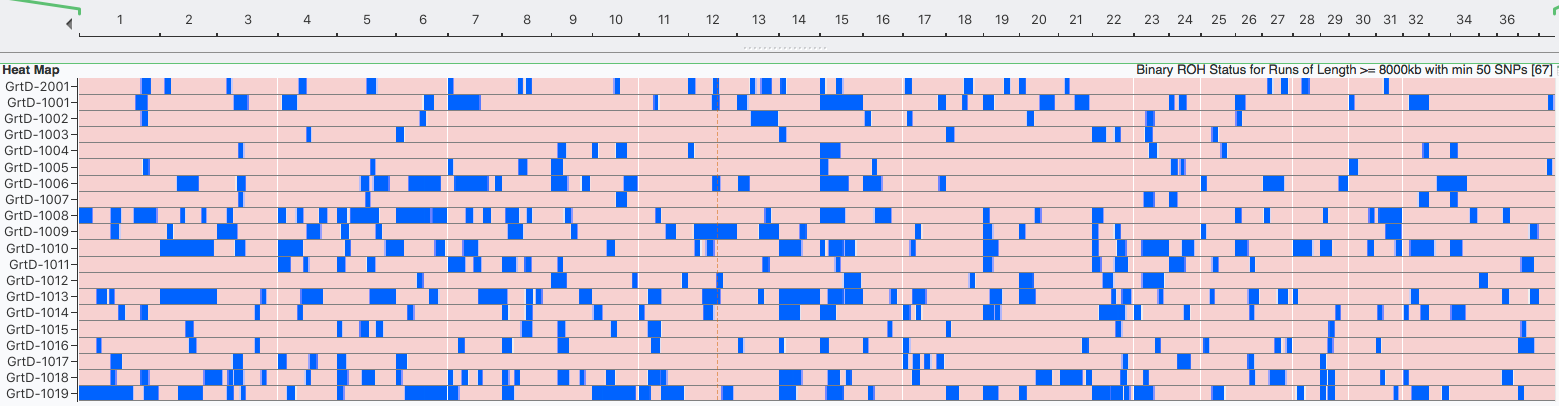
Runs of Homozygosity (ROH)
Inbreeding tends to produce runs (blocks) of homozygosity (ROH) on the chromosomes. Over time, the crossing-over of chromosomes during meiosis can split up blocks of homozygosity, so the largest blocks are likely to be the most recent inbreeding and smaller blocks reflect older inbreeding. ROH are used to estimate inbreeding from SNP data.
Learn more about Runs of Homozygosity.
Inbreeding: 25 generations (1000 kb)
Inbreeding: 6 generations (8000 kb)
Traits*
Health*
mtDNA & Y Haplotypes*
PCA*